
Page 5 - Fannin EDA 2020
P. 5
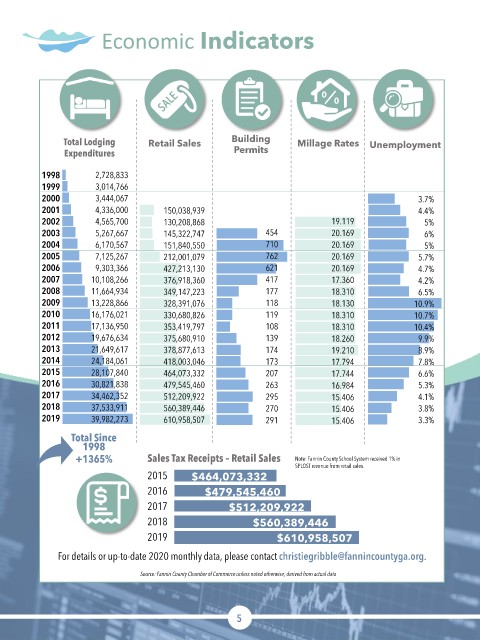
Economic Indicators


               Total Lodging      Retail Sales       Building       Millage Rates   Unemployment
               Expenditures                           Permits

          1998        2,728,833
          1999        3,014,766
          2000        3,444,067                                                                3.7%
          2001        4,336,000       150,038,939                                              4.4%
          2002        4,565,700       130,208,868                           19.119              5%
          2003        5,267,667       145,322,747            454            20.169              6%
          2004        6,170,567       151,840,550            710            20.169              5%
          2005        7,125,267       212,001,079            762            20.169             5.7%
          2006        9,303,366       427,213,130            621            20.169             4.7%
          2007        10,108,266      376,918,360            417            17.360             4.2%
          2008        11,664,934      349,147,223            177            18.310             6.5%
          2009        13,228,866      328,391,076            118            18.130            10.9%
          2010        16,176,021      330,680,826            119            18.310            10.7%
          2011        17,136,950      353,419,797            108            18.310            10.4%
          2012        19,676,634      375,680,910            139            18.260             9.9%
          2013        21,649,617      378,877,613            174            19.210             8.9%
          2014        24,184,061      418,003,046            173            17.794             7.8%
          2015        28,107,840      464,073,332            207            17.744             6.6%
          2016        30,821,838      479,545,460            263            16.984             5.3%
          2017        34,462,352      512,209,922            295            15.406             4.1%
          2018        37,533,911      560,389,446            270            15.406             3.8%
          2019        39,982,273      610,958,507            291            15.406             3.3%

                 Total Since
                    1998
                  +1365%          Sales Tax Receipts – Retail Sales  Note: Fannin County School System received 1% in
                                                                   SPLOST revenue from retail sales.
                                  2015      $464,073,332
                                  2016         $479,545,460
                                  2017               $512,209,922
                                  2018                    $560,389,446

                                  2019                         $610,958,507
              For details or up-to-date 2020 monthly data, please contact christiegribble@fannincountyga.org.

                                 Source: Fannin County Chamber of Commerce unless noted otherwise; derived from actual data


                                                      5